import pandas as pdfrom itables import init_notebook_mode, showinit_notebook_mode(all_interactive=False)# Load the holiday movies datasetholiday_movies = pd.read_csv("https://bcdanl.github.io/data/holiday_movies.csv")# Load the holiday movie genres datasetholiday_movie_genres = pd.read_csv("https://bcdanl.github.io/data/holiday_movie_genres.csv")holiday_movie_genres.columnsholiday_movies.columns
total_movies = holiday_movies.shape[0]print('Total number of movies:', total_movies)total_genres = holiday_movie_genres['genres'].value_counts()print('Number of movies per genre:')print(total_genres)
Total number of movies: 2265
Number of movies per genre:
genres
Comedy         1025
Drama           828
Romance         737
Family          707
Animation       268
Fantasy         185
Adventure       117
Documentary     101
Short            96
Music            91
Musical          78
Horror           63
Crime            44
Mystery          37
Thriller         32
Action           31
Sci-Fi           14
History          13
War               9
Western           6
Biography         6
Sport             5
Film-Noir         2
Talk-Show         2
News              1
Reality-TV        1
Name: count, dtype: int64
sorted_movies = holiday_movies.sort_values(by='average_rating', ascending=False)print('Top 5 movies by average rating')print(sorted_movies[['primary_title','average_rating']].head())
Top 5 movies by average rating
                       primary_title  average_rating
1204         NLO Spirit of Christmas            10.0
1433         Bringing Back Christmas             9.9
1522               Christmas Bone Us             9.8
1601    Cheap vs. Expensive Xmas Day             9.5
519   Marie Osmond's Merry Christmas             9.4
highly_rated_movies = holiday_movies[holiday_movies['average_rating'] >=8]print("Movies with average rating >= 8:")print(highly_rated_movies[['primary_title', 'average_rating']].head())
Movies with average rating >= 8:
                        primary_title  average_rating
45                  A Christmas Carol             8.1
48                      Roman Holiday             8.0
65          A Charlie Brown Christmas             8.3
68    How the Grinch Stole Christmas!             8.3
73  The Homecoming: A Christmas Story             8.3
movies_2000_onwards = holiday_movies[holiday_movies['year'] >=2000]print("Movies released in or after 2000:")show(movies_2000_onwards[['primary_title', 'year']])
Movies released in or after 2000:
primary_title
year
Loading ITables v2.2.4 from the init_notebook_mode cell...
(need help?)
movies_with_genres = pd.merge(holiday_movies, holiday_movie_genres, on='tconst', how='left')print('Movies with their genres:')show(movies_with_genres[['primary_title', 'genres']])
Movies with their genres:
primary_title
genres
Loading ITables v2.2.4 from the init_notebook_mode cell...
(need help?)
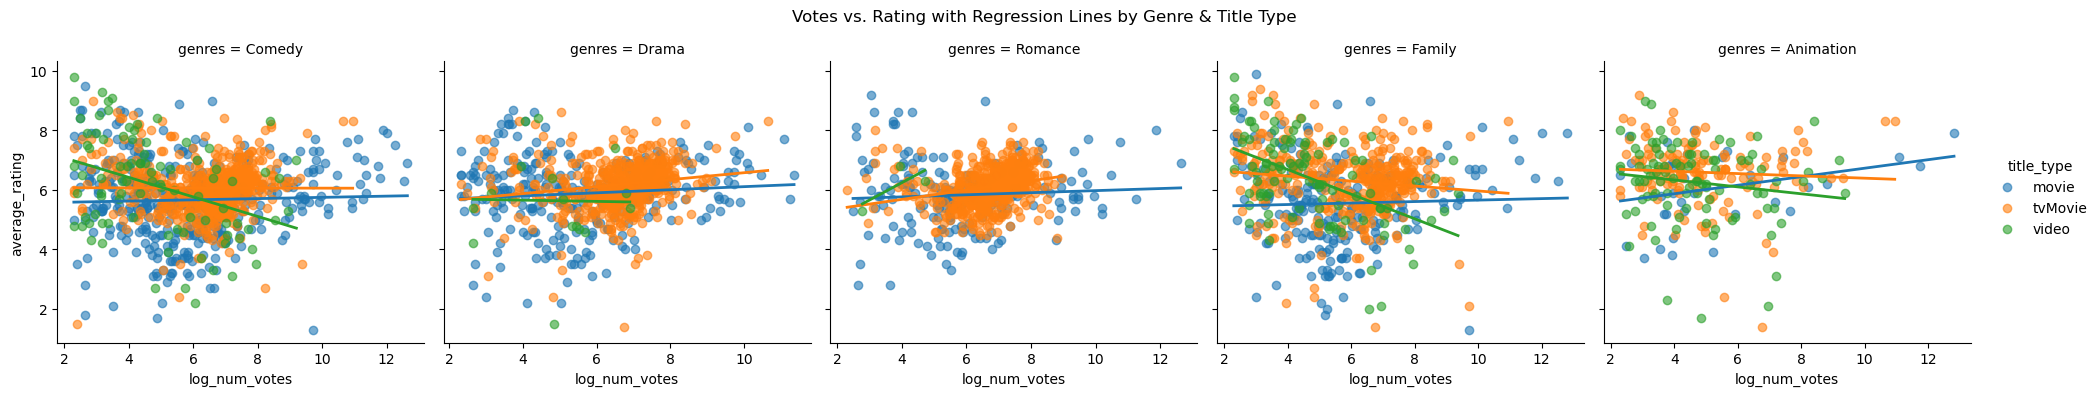
Top 5 Genres: Votes vs. Ratings by Title Type
import pandas as pdimport numpy as npimport seaborn as snsimport matplotlib.pyplot as plt# Load the datasetsmovies = pd.read_csv("https://bcdanl.github.io/data/holiday_movies.csv")genres = pd.read_csv("https://bcdanl.github.io/data/holiday_movie_genres.csv")# 1. Identify the five genres with the highest film countstop5 = genres['genres'].value_counts().nlargest(5).index.tolist()# 2. Merge on tconst, filter to those top genres, and add log(num_votes)df = ( movies .merge(genres, on='tconst') .query("genres in @top5") .assign(log_num_votes =lambda d: np.log(d['num_votes'])))# 3. Plot log(num_votes) vs. average_rating, faceted by genre & colored by title_typesns.lmplot( data=df, x='log_num_votes', y='average_rating', col='genres', hue='title_type', sharex=False, sharey=True, height=4, scatter_kws={'alpha': 0.6}, line_kws={'linewidth': 2}, ci=None)plt.subplots_adjust(top=0.85)plt.suptitle('Votes vs. Rating with Regression Lines by Genre & Title Type')plt.show()
/opt/anaconda3/lib/python3.12/site-packages/seaborn/regression.py:598: UserWarning: sharex is deprecated from the `lmplot` function signature. Please update your code to pass it using `facet_kws`.
  warnings.warn(msg, UserWarning)
/opt/anaconda3/lib/python3.12/site-packages/seaborn/regression.py:598: UserWarning: sharey is deprecated from the `lmplot` function signature. Please update your code to pass it using `facet_kws`.
  warnings.warn(msg, UserWarning)
Interpretation:
Documentaries exhibit the strongest positive relationship between vote count and rating—higher-voted docs almost always earn better reviews. Family and Drama films also trend upward, though with more spread: popular titles tend to have higher ratings but there are outliers. Comedy shows nearly no slope, indicating vote totals tell us little about comedic quality, while Romance sits in between. Across title types, Movies generally cluster at higher vote levels and ratings, whereas TV Shorts are more dispersed and tend to receive lower average ratings.